


- Watch: VWAP Strategy: The Line Day Traders Watch
- What is VWAP?
- Why day traders watch VWAP
- VWAP strategy #1: the trend-day hold
- VWAP strategy #2: the reclaim and the reject
- A reclaim that worked
- The reject: the same idea, flipped
- A reclaim that failed (and why that is normal)
- Volume Pressure
- When to ignore VWAP: chop days
- VWAP and 9 EMA strategy: one rule
- 3 VWAP mistakes to avoid
- The VWAP trading checklist
- VWAP FAQ
Above VWAP, buyers have been in control today. Below it, sellers. That one line is why a simple VWAP trading strategy is a staple for day traders: a lot of intraday pullbacks get decided right at it. The trick is knowing which days the line matters, and which days it is just noise.
This guide covers what VWAP actually is and why it resets every session, the trend-day hold, the reclaim and reject entry, when to ignore VWAP completely, and one simple rule for pairing VWAP with the 9 EMA. Every chart here is a real past example on 5-minute candles, with VWAP computed from the bars themselves. It is educational, not a trade recommendation, and trading involves risk.
Watch: VWAP Strategy: The Line Day Traders Watch
What is VWAP?
VWAP stands for volume-weighted average price. It is the average price traded during the session, weighted by how much volume traded at each price. The math is simpler than it sounds:
- For every candle, take the typical price: (high + low + close) ÷ 3.
- Multiply the typical price by that candle’s volume.
- Add those results up from the open, then divide by all the volume traded so far.
Because of the volume weighting, a heavy-volume candle pulls the line harder than a quiet one. That is why VWAP often moves fast in the first few minutes of the day, when volume is heaviest, and then settles into a slower slope.

VWAP resets every session
VWAP is a one-day calculation. At each open the running totals start over, so the line restarts at the first candle and builds from there. On a multi-day intraday chart you will see the line break at every open. That reset is what makes VWAP a day-trading tool: it tells you about today’s buyers and sellers, not last week’s. If you want a level that spans many sessions, a tool like the volume profile or classic support and resistance zones is a better fit.

Why day traders watch VWAP
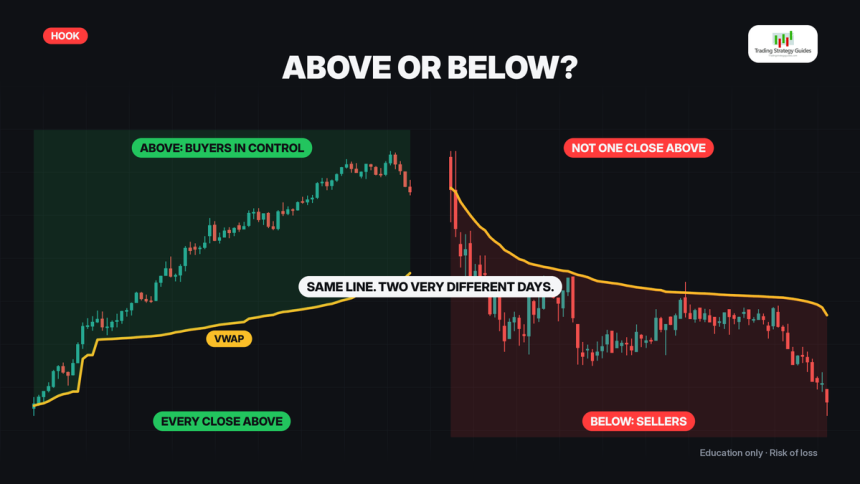
VWAP is roughly the average price paid today. Large funds use it to grade their own fills, which is one reason so many eyes are on it. The logic traders use is simple: above the line, the average buyer today is sitting on a gain. Below it, the average buyer is underwater. So above VWAP, buyers have the edge. Below it, sellers do.
The two extremes look like this. On one day, an index fund closed every single 5-minute candle above VWAP. On another, a big retailer did not close one candle above it all session.

VWAP strategy #1: the trend-day hold
On a trend day, VWAP slopes in the direction of the trend and price stays on one side of it. Pullbacks back to the line are the spot to watch. In the example below, a big index fund ran in the morning, spent a couple of hours drifting back, and finally tagged VWAP. It held. After the first half hour of the session, not one 5-minute candle closed under the line.

The down version is the mirror. Here a small-cap fund trended lower with VWAP sloping down all day. Price rallied back into the line, touched it, and got sold. After the first half hour, it never closed above VWAP. If you were buying every dip that day, the line was telling you not to.

VWAP strategy #2: the reclaim and the reject
The reclaim is the entry most traders use VWAP for. The idea is to wait for price to prove it can live on the other side of the line before you act:
- Price has been under VWAP for a while.
- A candle closes back above VWAP. This is step one, not the entry.
- Wait for the next dip back to the line. If that dip holds and closes above VWAP, that is the entry.
- The stop goes under the low of the reclaim candle and the dip.
- If price closes back under VWAP, the idea is wrong.

A reclaim that worked
Here is that sequence on a chipmaker. Price spent most of the first ninety minutes under VWAP, then closed back above it. The very next candle dipped right to the line and closed above it. That was the entry, with the stop under those two candles. Every close for the rest of the day stayed above VWAP, the stop was never touched, and price made a new high of the day late in the session.

The reject: the same idea, flipped
The reject is the short-side version. A social media name spent over an hour above VWAP, then a candle closed below it. The next candle bounced up into the line and closed back under. The stop goes above those two candles. Price stayed under VWAP for the rest of the session and made a new low of the day.

A reclaim that failed (and why that is normal)
Not every reclaim works, and it is worth being honest about how often they do not. Below, a big tech name closed back above VWAP and the next candle held. Textbook. Two candles later it closed back under the line, the stop was hit, and price spent almost the entire rest of the day below VWAP, making new lows.

That is not rare. In a scan of 20 big, liquid names, about two out of three first reclaims that dipped back to the line and held still hit that tight stop before the close. A VWAP reclaim is a trigger, not an edge by itself. The filter in the next section is what decides whether the trigger is worth taking.
When to ignore VWAP: chop days
On a chop day, VWAP stops acting like support or resistance and becomes the middle of the range. Below, an EV maker crossed its VWAP twenty-one times in one session. Look at the line itself: it is almost flat. When VWAP is flat and price keeps flipping sides, a reclaim does not mean much.

The same scan backs this up. On days with ten or more VWAP crosses, about nine out of ten of those reclaims hit the stop. Before you take any VWAP entry, run a two-question chop filter:
- Is the line sloping, or flat? A sloping VWAP means one side has been in control.
- How many times has price already crossed it today? A few crosses is normal. Crossing again and again is chop.
A sloping line with few crosses is a trend day, and the hold and the reclaim are worth your attention. A flat line that has been crossed again and again is a chop day. On a chop day, sit on your hands.
VWAP and 9 EMA strategy: one rule
A lot of traders pair VWAP with the 9 EMA, a fast exponential moving average. One simple way to split the jobs: VWAP decides the direction, and the 9 EMA times the entry. Above VWAP, only look for long pullbacks to the 9 EMA. Below VWAP, only look for short pops into it. The one rule: never trade the 9 EMA against VWAP.
On a trend day in a blue-chip index fund, price dipped to the 9 EMA seven times after the first hour, and it never closed under VWAP. The 9 EMA stayed above VWAP the whole way, so each dip to the fast line was a pullback in the direction of the trend.

Now the other side. Remember the small-cap fund that stayed under VWAP after the first half hour? That day, price closed back above the 9 EMA eight times. Each one looked like a turn. Not one of them got a close above VWAP. That is what trading the 9 EMA against VWAP looks like.

3 VWAP mistakes to avoid
- Buying the first close above VWAP instead of waiting for the dip that holds.
- Trading reclaims on a flat, choppy line. If price keeps flipping sides, the line is the middle of the range.
- Carrying VWAP over to the next day. It resets every morning. Yesterday’s line does not carry over to today’s open.
The VWAP trading checklist
- Is VWAP sloping, or flat? If it is flat and price keeps crossing it, skip the day.
- If it is sloping, trade only in that direction.
- Wait for a close back across the line, then a dip that holds.
- Put the stop on the other side of those candles.
- If price closes back through VWAP, you are out.
Before you risk a dollar, mark twenty past VWAP days on your own charts: trend days, chop days, reclaims that worked and reclaims that failed. You will start to see the difference between the two kinds of day quickly.
VWAP FAQ
What timeframe is VWAP used on?
VWAP is an intraday tool. The examples here use 5-minute candles, and the line looks nearly the same on other intraday charts, because it is built from the whole session’s volume rather than a fixed number of bars.
Is VWAP support or resistance?
On a trend day it often behaves like one, which is the trend-day hold. On a chop day it does not: price crosses it again and again and the line is just the middle of the range.
Does VWAP carry over to the next day?
No. Standard VWAP resets at every open. If you want more background on the indicator itself, see our VWAP indicator guide. New to intraday trading? Start with day trading for beginners.
Every chart in this guide is a real past example for education only. These are not trade recommendations, past examples do not predict future results, and trading involves risk of loss.